预览
背景
{"level":"error","ts":1753604356.9313068,"logger":"http.log.error","msg":"dial tcp: lookup remotely_app on 127.0.0.11:53: no such host","request":{"remote_ip":"49.73.126.48","remote_port":"32192","client_ip":"49.73.126.48","proto":"HTTP/2.0","method":"POST","host":"remotely.aiursoft.cn","uri":"/hubs/service/negotiate?negotiateVersion=1","headers":{"User-Agent":["Microsoft SignalR/8.0 (8.0.2+da7e9894ce22ef8cc02e5acc56e95a6f8cf8f644; Windows NT; .NET; .NET 8.0.2)"],"X-Requested-With":["XMLHttpRequest"],"Content-Length":["0"]},"tls":{"resumed":true,"version":771,"cipher_suite":49195,"proto":"h2","server_name":"remotely.aiursoft.cn"}},"duration":0.003472111,"status":502,"err_id":"sz0r0viky","err_trace":"reverseproxy.statusError (reverseproxy.go:1390)"}
{"level":"error","ts":1753604356.9313471,"logger":"http.log.access","msg":"handled request","request":{"remote_ip":"49.73.126.48","remote_port":"32192","client_ip":"49.73.126.48","proto":"HTTP/2.0","method":"POST","host":"remotely.aiursoft.cn","uri":"/hubs/service/negotiate?negotiateVersion=1","headers":{"X-Requested-With":["XMLHttpRequest"],"Content-Length":["0"],"User-Agent":["Microsoft SignalR/8.0 (8.0.2+da7e9894ce22ef8cc02e5acc56e95a6f8cf8f644; Windows NT; .NET; .NET 8.0.2)"]},"tls":{"resumed":true,"version":771,"cipher_suite":49195,"proto":"h2","server_name":"remotely.aiursoft.cn"}},"bytes_read":0,"user_id":"","duration":0.003472111,"size":0,"status":502,"resp_headers":{"Server":["Caddy"],"Alt-Svc":["h3=\":443\"; ma=2592000"],"Strict-Transport-Security":["max-age=63072000"]}}
上面,是我caddy产生的日志。
最近我很关心一些数据,例如:
- 哪个IP请求量大?横轴时间,纵轴请求量,颜色IP。
- 哪个应用最火?横轴按时间,纵轴请求量,颜色应用。
- 对于一个IP,他都在请求什么应用?横轴按时间,纵轴请求量,颜色应用。
- 对于一个应用,都是什么IP在请求?横轴按时间,纵轴请求量。
- 应用的哪个路径最慢,哪个最快?排序并显示耗时?随时间变化?
- 应用的错误代码是如何分布的?随时间变化?
- 对于一个应用的一个错误代码,它都是什么路径?随时间变化?
- 哪个应用错误率最多?随时间变化?
现在,我需要展示成图,并方便的filter。我试过grafana,感觉grafana不合适:grafana只能展示数,不能展示path这种。它更像 是监控一个只能产生数值的传感器随时间的变化。
我想要的是一个类似时序数据库,里面每一行都是一次请求。同时我可以快速的加filter、group by、order by等来绘制成图,类似微软的Kusto,PowerBI。
我需要有开源的解决方案。现在日志都在stdout里。要能self host的,支持docker的。
最终,经过调查,决定使用 ClickHouse + Superset 来可视化我的界面。
计划
我想,接下来的工作,可能需要好几个步骤。但主要来说,就四步:
- 确保caddy的日志能够输出到文件、stdout,并格式化好。最好是JSON。
- 搭一个进程,消费caddy的日志,并将其实时的存储到clickhouse db里。
- 使用一个图形化查看器,连上clickhouse db,开始分析这些数据,并确保数据干净可用有价值。
- 搭一个web portal,将分析的结果可视化成网页的图表,来展示给IT人员。
这个计划我认为非常完备,没什么可能的问题了。准备开始实施!
细节的说,我可能需要 Python 进行采集。然后创建到 Clickhouse 表里。最后用个 Superset 来可视化。
得到标准的日志流
对于第一步,我是这么做的:自己编译Caddy,然后往里增加了几个插件,确保它能输出我要的格式的日志。
我还额外增加了 brotli 压缩、transform-encoder 以及 rate limit 的功能。
# ============================
# Prepare caddy Environment
FROM caddy:builder AS caddy-build-env

RUN xcaddy build \
    --with github.com/ueffel/caddy-brotli \
    --with github.com/caddyserver/transform-encoder \
    --with github.com/mholt/caddy-ratelimit

# ============================
# Prepare Caddyfile build Environment
FROM localhost:8080/box_starting/local_ubuntu AS config-build-env
WORKDIR /app
COPY . .

# Outputs to /app/Dist/Caddyfile
RUN chmod +x /app/build_proxy.sh
RUN /bin/bash /app/build_proxy.sh

# ============================
# Prepare Runtime Environment
FROM caddy

WORKDIR /app

EXPOSE 80 443

COPY --from=caddy-build-env /usr/bin/caddy /usr/bin/caddy
COPY --from=config-build-env /app/Dist/Caddyfile /etc/caddy/Caddyfile

# Check if any fatal errors in caddyfile
RUN caddy validate --config /etc/caddy/Caddyfile --adapter caddyfile && \
    mkdir -p /var/log/caddy && \
    touch /data/caddy/logs/web.log

ENTRYPOINT ["sh", "-c", "caddy run --config /etc/caddy/Caddyfile --adapter caddyfile & tail -f /data/caddy/logs/web.log & wait"]
我使用上述Dockerfile来编译caddy。
而 caddyfile 的开头,我补上了:
{
	email anduin@aiursoft.com
	log {
		format json
		# 注意,日志写到了:/data/caddy/logs/web.log
		# /data 目录是容器的一个 VOLUME, 会穿透到主机。
		output file /data/caddy/logs/web.log {
			roll_size 1gb
			roll_uncompressed
		}
		level debug
	}
	servers :443 {
		listener_wrappers {
			proxy_protocol {
        # 注意:这里的 proxy_protocol 需要开启,才能支持 FRP 的代理。
				timeout 2s
				allow 10.233.0.0/16
			}
			http_redirect
			tls
		}
	}
}
来确保它会输出log。
然后我使用了下面的 docker-compose 来启动我的 caddy:
version: '3.9'

services:
  sites:
    image: localhost:8080/box_starting/local_sites
    ports:
      # These ports are for internal use. For external, FRP will handle it.
      - target: 80
        published: 80
        protocol: tcp
        mode: host
      - target: 443
        published: 443
        protocol: tcp
        mode: host
    networks:
      - frp_net
      - proxy_app
    volumes:
      # 注意:Sites 容器里的 /data 目录存着 log。
      - sites-data:/data
    stop_grace_period: 60s
    deploy:
      resources:
        limits:
          cpus: '8.0'
          memory: 16G
      update_config:
        order: stop-first
        delay: 60s

volumes:
  sites-data:
    driver: local
    driver_opts:
      type: none
      o: bind
      device: /swarm-vol/sites-data

networks:
  proxy_app:
    external: true
现在,我已经确定了日志正常:
anduin@proart:/swarm-vol/Box$ sudo docker ps | grep sites
bd9f24b9c79f   localhost:8080/box_starting/local_sites:latest                                   "sh -c 'caddy run --…"    5 minutes ago        Up 5 minutes                           0.0.0.0:80->80/tcp, [::]:80->80/tcp, 0.0.0.0:443->443/tcp, [::]:443->443/tcp, 443/udp, 2019/tcp      incoming_sites.1.mai5g7xgxugy5p4prfwk4ohey
anduin@proart:/swarm-vol/Box$ sudo docker logs -f bd9f24b9c79f
{"level":"debug","ts":1753604514.283448,"logger":"tls.handshake","msg":"matched certificate in cache","remote_ip":"49.13.130.29","remote_port":"3132","subjects":["auth.aiursoft.cn"],"managed":true,"expiration":1759912228,"hash":"35212a5b8ae720958f58e378d367bba7c7f2fb75451851a14eec9cb96b54542e"}
{"level":"debug","ts":1753604514.3975098,"logger":"http.handlers.reverse_proxy","msg":"selected upstream","dial":"stathub_stathubserver:5000","total_upstreams":1}
{"level":"debug","ts":1753604514.3991885,"logger":"http.handlers.reverse_proxy","msg":"upstream roundtrip","upstream":"stathub_stathubserver:5000","duration":0.001577048,"request":{"remote_ip":"119.29.247.197","remote_port":"57854","client_ip":"119.29.247.197","proto":"HTTP/1.1","method":"POST","host":"stathub.aiursoft.cn","uri":"/api/metrics","headers":{"X-Forwarded-Host":["stathub.aiursoft.cn"],"Via":["1.1 Caddy"],"Accept":["application/json"],"Content-Type":["application/json; charset=utf-8"],"Content-Length":["2604"],"User-Agent":[""],"X-Forwarded-For":["119.29.247.197"],"X-Forwarded-Proto":["https"]},"tls":{"resumed":false,"version":772,"cipher_suite":4865,"proto":"","server_name":"stathub.aiursoft.cn"}},"headers":{"X-Frame-Options":["SAMEORIGIN"],"Content-Security-Policy":["frame-ancestors 'self'"],"Content-Type":["application/json; charset=utf-8"],"Date":["Sun, 27 Jul 2025 08:21:53 GMT"],"Server":["Kestrel"],"Vary":["Accept-Encoding"]},"status":201}
{"level":"info","ts":1753604514.3996112,"logger":"http.log.access","msg":"handled request","request":{"remote_ip":"119.29.247.197","remote_port":"57854","client_ip":"119.29.247.197","proto":"HTTP/1.1","method":"POST","host":"stathub.aiursoft.cn","uri":"/api/metrics","headers":{"Accept":["application/json"],"Content-Type":["application/json; charset=utf-8"],"Content-Length":["2604"]},"tls":{"resumed":false,"version":772,"cipher_suite":4865,"proto":"","server_name":"stathub.aiursoft.cn"}},"bytes_read":2604,"user_id":"","duration":0.002170407,"size":56,"status":201,"resp_headers":{"Alt-Svc":["h3=\":443\"; ma=2592000"],"Vary":["Accept-Encoding"],"Content-Security-Policy":["frame-ancestors 'self'"],"Date":["Sun, 27 Jul 2025 08:21:53 GMT"],"Server":["Kestrel"],"Via":["1.1 Caddy"],"Strict-Transport-Security":["max-age=63072000"],"X-Frame-Options":["SAMEORIGIN"],"Content-Type":["application/json; charset=utf-8"]}}
{"level":"debug","ts":1753604514.6455557,"logger":"http.handlers.reverse_proxy","msg":"selected upstream","dial":"authentik_server:9000","total_upstreams":1}
{"level":"debug","ts":1753604514.672455,"logger":"http.handlers.reverse_proxy","msg":"upstream roundtrip","upstream":"authentik_server:9000","duration":0.026780181,"request":{"remote_ip":"49.13.130.29","remote_port":"3132","client_ip":"49.13.130.29","proto":"HTTP/1.1","method":"HEAD","host":"auth.aiursoft.cn","uri":"/application/o/authorize/?client_id=wzt4srMcPxcNgaQh70XZtOoBCAlmTgV6IjeRAyUj&response_type=code&scope=email+nextcloud+openid&redirect_uri=https%3A%2F%2Fnextcloud.aiursoft.cn%2Findex.php%2Fapps%2Fuser_oidc%2Fcode&claims=%7B%22id_token%22%3A%7B%22email%22%3Anull%2C%22name%22%3Anull%2C%22quota%22%3Anull%2C%22groups%22%3Anull%2C%22user_id%22%3A%7B%22essential%22%3Atrue%7D%7D%2C%22userinfo%22%3A%7B%22email%22%3Anull%2C%22name%22%3Anull%2C%22quota%22%3Anull%2C%22groups%22%3Anull%2C%22user_id%22%3A%7B%22essential%22%3Atrue%7D%7D%7D&state=YN7C2YTH1G0GUERS9AWJIEGJE3VIHP6Y&nonce=0DHHR241WY94Q359GYXM9RL1CEOGQMC9&code_challenge=3WDMHL3_vwH_RAtCF1EQe62C957HZPcLqQz3Uhky8uM&code_challenge_method=S256","headers":{"Cache-Control":["no-cache"],"User-Agent":["Mozilla/5.0+(compatible; UptimeRobot/2.0; http://www.uptimerobot.com/)"],"Accept":["text/html,application/xhtml+xml,application/xml;q=0.9,*/*;q=0.8"],"Accept-Encoding":["gzip, deflate, br"],"X-Forwarded-Proto":["https"],"Via":["1.1 Caddy"],"X-Forwarded-For":["49.13.130.29"],"Referer":["https://nextcloud.aiursoft.cn"],"Accept-Language":["en-US,en;q=0.8"],"X-Forwarded-Host":["auth.aiursoft.cn"]},"tls":{"resumed":false,"version":772,"cipher_suite":4865,"proto":"","server_name":"auth.aiursoft.cn"}},"headers":{"X-Authentik-Id":["8c7197d81ceb4b59b6bea27db85eb80f"],"X-Frame-Options":["DENY"],"Content-Type":["text/html; charset=utf-8"],"Location":["/flows/-/default/authentication/?next=/application/o/authorize/%3Fclient_id%3Dwzt4srMcPxcNgaQh70XZtOoBCAlmTgV6IjeRAyUj%26response_type%3Dcode%26scope%3Demail%2Bnextcloud%2Bopenid%26redirect_uri%3Dhttps%253A%252F%252Fnextcloud.aiursoft.cn%252Findex.php%252Fapps%252Fuser_oidc%252Fcode%26claims%3D%257B%2522id_token%2522%253A%257B%2522email%2522%253Anull%252C%2522name%2522%253Anull%252C%2522quota%2522%253Anull%252C%2522groups%2522%253Anull%252C%2522user_id%2522%253A%257B%2522essential%2522%253Atrue%257D%257D%252C%2522userinfo%2522%253A%257B%2522email%2522%253Anull%252C%2522name%2522%253Anull%252C%2522quota%2522%253Anull%252C%2522groups%2522%253Anull%252C%2522user_id%2522%253A%257B%2522essential%2522%253Atrue%257D%257D%257D%26state%3DYN7C2YTH1G0GUERS9AWJIEGJE3VIHP6Y%26nonce%3D0DHHR241WY94Q359GYXM9RL1CEOGQMC9%26code_challenge%3D3WDMHL3_vwH_RAtCF1EQe62C957HZPcLqQz3Uhky8uM%26code_challenge_method%3DS256"],"Referrer-Policy":["same-origin"],"Set-Cookie":["REDACTED"],"Vary":["Accept-Encoding","Cookie"],"X-Content-Type-Options":["nosniff"],"X-Powered-By":["authentik"],"Content-Length":["23"],"Content-Encoding":["gzip"],"Date":["Sun, 27 Jul 2025 08:21:54 GMT"]},"status":302}
{"level":"info","ts":1753604514.6726158,"logger":"http.log.access","msg":"handled request","request":{"remote_ip":"49.13.130.29","remote_port":"3132","client_ip":"49.13.130.29","proto":"HTTP/1.1","method":"HEAD","host":"auth.aiursoft.cn","uri":"/application/o/authorize/?client_id=wzt4srMcPxcNgaQh70XZtOoBCAlmTgV6IjeRAyUj&response_type=code&scope=email+nextcloud+openid&redirect_uri=https%3A%2F%2Fnextcloud.aiursoft.cn%2Findex.php%2Fapps%2Fuser_oidc%2Fcode&claims=%7B%22id_token%22%3A%7B%22email%22%3Anull%2C%22name%22%3Anull%2C%22quota%22%3Anull%2C%22groups%22%3Anull%2C%22user_id%22%3A%7B%22essential%22%3Atrue%7D%7D%2C%22userinfo%22%3A%7B%22email%22%3Anull%2C%22name%22%3Anull%2C%22quota%22%3Anull%2C%22groups%22%3Anull%2C%22user_id%22%3A%7B%22essential%22%3Atrue%7D%7D%7D&state=YN7C2YTH1G0GUERS9AWJIEGJE3VIHP6Y&nonce=0DHHR241WY94Q359GYXM9RL1CEOGQMC9&code_challenge=3WDMHL3_vwH_RAtCF1EQe62C957HZPcLqQz3Uhky8uM&code_challenge_method=S256","headers":{"Referer":["https://nextcloud.aiursoft.cn"],"User-Agent":["Mozilla/5.0+(compatible; UptimeRobot/2.0; http://www.uptimerobot.com/)"],"Accept":["text/html,application/xhtml+xml,application/xml;q=0.9,*/*;q=0.8"],"Accept-Encoding":["gzip, deflate, br"],"Accept-Language":["en-US,en;q=0.8"],"Cache-Control":["no-cache"],"Connection":["close"]},"tls":{"resumed":false,"version":772,"cipher_suite":4865,"proto":"","server_name":"auth.aiursoft.cn"}},"bytes_read":0,"user_id":"","duration":0.027245944,"size":0,"status":302,"resp_headers":{"Via":["1.1 Caddy"],"Content-Length":["23"],"Date":["Sun, 27 Jul 2025 08:21:54 GMT"],"X-Frame-Options":["DENY"],"Alt-Svc":["h3=\":443\"; ma=2592000"],"Content-Encoding":["gzip"],"X-Authentik-Id":["8c7197d81ceb4b59b6bea27db85eb80f"],"Set-Cookie":["REDACTED"],"Strict-Transport-Security":["max-age=63072000"],"Content-Type":["text/html; charset=utf-8"],"Referrer-Policy":["same-origin"],"X-Content-Type-Options":["nosniff"],"Location":["/flows/-/default/authentication/?next=/application/o/authorize/%3Fclient_id%3Dwzt4srMcPxcNgaQh70XZtOoBCAlmTgV6IjeRAyUj%26response_type%3Dcode%26scope%3Demail%2Bnextcloud%2Bopenid%26redirect_uri%3Dhttps%253A%252F%252Fnextcloud.aiursoft.cn%252Findex.php%252Fapps%252Fuser_oidc%252Fcode%26claims%3D%257B%2522id_token%2522%253A%257B%2522email%2522%253Anull%252C%2522name%2522%253Anull%252C%2522quota%2522%253Anull%252C%2522groups%2522%253Anull%252C%2522user_id%2522%253A%257B%2522essential%2522%253Atrue%257D%257D%252C%2522userinfo%2522%253A%257B%2522email%2522%253Anull%252C%2522name%2522%253Anull%252C%2522quota%2522%253Anull%252C%2522groups%2522%253Anull%252C%2522user_id%2522%253A%257B%2522essential%2522%253Atrue%257D%257D%257D%26state%3DYN7C2YTH1G0GUERS9AWJIEGJE3VIHP6Y%26nonce%3D0DHHR241WY94Q359GYXM9RL1CEOGQMC9%26code_challenge%3D3WDMHL3_vwH_RAtCF1EQe62C957HZPcLqQz3Uhky8uM%26code_challenge_method%3DS256"],"Vary":["Accept-Encoding","Cookie"],"X-Powered-By":["authentik"]}}
{"level":"debug","ts":1753604514.6838558,"logger":"http.handlers.reverse_proxy","msg":"selected upstream","dial":"stathub_stathubserver:5000","total_upstreams":1}
{"level":"debug","ts":1753604514.6847696,"logger":"http.handlers.reverse_proxy","msg":"upstream roundtrip","upstream":"stathub_stathubserver:5000","duration":0.000850831,"request":{"remote_ip":"192.168.50.62","remote_port":"58904","client_ip":"192.168.50.62","proto":"HTTP/1.1","method":"POST","host":"stathub.aiursoft.cn","uri":"/api/metrics","headers":{"Accept":["application/json"],"Content-Type":["application/json; charset=utf-8"],"Content-Length":["2650"],"User-Agent":[""],"X-Forwarded-For":["192.168.50.62"],"X-Forwarded-Proto":["https"],"X-Forwarded-Host":["stathub.aiursoft.cn"],"Via":["1.1 Caddy"]},"tls":{"resumed":true,"version":772,"cipher_suite":4865,"proto":"","server_name":"stathub.aiursoft.cn"}},"headers":{"Content-Type":["application/json; charset=utf-8"],"Date":["Sun, 27 Jul 2025 08:21:53 GMT"],"Server":["Kestrel"],"Vary":["Accept-Encoding"],"X-Frame-Options":["SAMEORIGIN"],"Content-Security-Policy":["frame-ancestors 'self'"]},"status":201}
{"level":"info","ts":1753604514.684859,"logger":"http.log.access","msg":"handled request","request":{"remote_ip":"192.168.50.62","remote_port":"58904","client_ip":"192.168.50.62","proto":"HTTP/1.1","method":"POST","host":"stathub.aiursoft.cn","uri":"/api/metrics","headers":{"Accept":["application/json"],"Content-Type":["application/json; charset=utf-8"],"Content-Length":["2650"]},"tls":{"resumed":true,"version":772,"cipher_suite":4865,"proto":"","server_name":"stathub.aiursoft.cn"}},"bytes_read":2650,"user_id":"","duration":0.001125525,"size":56,"status":201,"resp_headers":{"Content-Security-Policy":["frame-ancestors 'self'"],"Content-Type":["application/json; charset=utf-8"],"Alt-Svc":["h3=\":443\"; ma=2592000"],"X-Frame-Options":["SAMEORIGIN"],"Date":["Sun, 27 Jul 2025 08:21:53 GMT"],"Server":["Kestrel"],"Vary":["Accept-Encoding"],"Via":["1.1 Caddy"],"Strict-Transport-Security":["max-age=63072000"]}}
{"level":"debug","ts":1753604514.756761,"logger":"http.handlers.reverse_proxy","msg":"selected upstream","dial":"stathub_stathubserver:5000","total_upstreams":1}
{"level":"debug","ts":1753604514.7580035,"logger":"http.handlers.reverse_proxy","msg":"upstream roundtrip","upstream":"stathub_stathubserver:5000","duration":0.001143758,"request":{"remote_ip":"45.77.178.215","remote_port":"41356","client_ip":"45.77.178.215","proto":"HTTP/1.1","method":"POST","host":"stathub.aiursoft.cn","uri":"/api/metrics","headers":{"Via":["1.1 Caddy"],"Accept":["application/json"],"Content-Type":["application/json; charset=utf-8"],"Content-Length":["2591"],"User-Agent":[""],"X-Forwarded-For":["45.77.178.215"],"X-Forwarded-Proto":["https"],"X-Forwarded-Host":["stathub.aiursoft.cn"]},"tls":{"resumed":false,"version":772,"cipher_suite":4865,"proto":"","server_name":"stathub.aiursoft.cn"}},"headers":{"Date":["Sun, 27 Jul 2025 08:21:53 GMT"],"Server":["Kestrel"],"Vary":["Accept-Encoding"],"X-Frame-Options":["SAMEORIGIN"],"Content-Security-Policy":["frame-ancestors 'self'"],"Content-Type":["application/json; charset=utf-8"]},"status":201}
将日志进行消费
上面 caddy 的日志,要重点理解:它不是标准的JSON格式,而是每行都是一个 JSON。必须一行一行的读。如果整个文件一起反序列化就完蛋了。而且随着请求抵达,都会不停给它追加新的行。
在继续之前,为了确保我对文件的穿透理解是正确的,我来到了主机上:
anduin@proart:/swarm-vol/sites-data/caddy/logs$ ls
web.log
anduin@proart:/swarm-vol/sites-data/caddy/logs$ ls -ashl
total 6.3M
4.0K drwxr-xr-x 2 root root 4.0K Jul 27 08:44 .
4.0K drwxr-xr-x 7 root root 4.0K Jul 27 08:44 ..
6.2M -rw------- 1 root root 6.2M Jul 27 08:54 web.log
anduin@proart:/swarm-vol/sites-data/caddy/logs$
这可以证实,sites,也就是 caddy 这个容器的 /sites-data/caddy/logs 目录下已经存着了 web.log
现在,我认为接下来我们应该专注的事情,就是如何建设起来 clickhouse 数据库,并将caddy的日志解析好流进clickhouse里。
我们可以分三步走:
- 部署 ClickHouse
- 设计并创建日志表结构
- 用 Python 采集 Caddy JSON 日志、解析并写入 ClickHouse
部署 Clickhouse
为了部署 Clickhouse,我修改了 docker-compose.yml
  clickhouse:
    image: hub.aiursoft.cn/clickhouse/clickhouse-server:latest
    ports:
      - target: 8123
        published: 8123
        protocol: tcp
        mode: host
      - target: 9000
        published: 9000
        protocol: tcp
        mode: host
    volumes:
      - click-house-data:/var/lib/clickhouse
    stop_grace_period: 60s
    deploy:
      resources:
        limits:
          cpus: '4.0'
          memory: 8G
      update_config:
        order: stop-first
        delay: 60s
很快啊,我跑起来了 clickhouse:
anduin@proart:/swarm-vol/Box$ sudo docker ps | grep clickhouse
99dae96430f9   hub.aiursoft.cn/clickhouse/clickhouse-server:latest                              "/entrypoint.sh"          8 seconds ago    Up 7 seconds              0.0.0.0:8123->8123/tcp, [::]:8123->8123/tcp, 0.0.0.0:9000->9000/tcp, [::]:9000->9000/tcp, 9009/tcp   incoming_clickhouse.1.3w3lo1xg8fywgzswzyvufi072
anduin@proart:/swarm-vol/Box$ sudo docker logs -f 99dae96430f9
/entrypoint.sh: neither CLICKHOUSE_USER nor CLICKHOUSE_PASSWORD is set, disabling network access for user 'default'
Processing configuration file '/etc/clickhouse-server/config.xml'.
Merging configuration file '/etc/clickhouse-server/config.d/docker_related_config.xml'.
Logging trace to /var/log/clickhouse-server/clickhouse-server.log
Logging errors to /var/log/clickhouse-server/clickhouse-server.err.log
^Canduin@proart:/swarm-vol/Box$ cd /swarm-vol/sites-click-house-data/
anduin@proart:/swarm-vol/sites-click-house-data$ ls
access  data  flags  format_schemas  metadata  metadata_dropped  preprocessed_configs  status  store  tmp  user_files  uuid
anduin@proart:/swarm-vol/sites-click-house-data$
看起来 clickhouse 一切正常,于是我很快也进去了:
anduin@proart:/swarm-vol/sites-click-house-data$ sudo docker exec -it 99dae96430f9 clickhouse-client --user default
ClickHouse client version 25.6.4.12 (official build).
Connecting to localhost:9000 as user default.
Connected to ClickHouse server version 25.6.4.

Warnings:
 * Delay accounting is not enabled, OSIOWaitMicroseconds will not be gathered. You can enable it using `echo 1 > /proc/sys/kernel/task_delayacct` or by using sysctl.

99dae96430f9 :)
创建 Clickhouse 的表
接下来,我们应该仔细分析caddy的日志,在这里需要谨慎的建表,毕竟这个可能未来会很难变更了。我思考了一段时间以后,执行了:
99dae96430f9 :) CREATE DATABASE IF NOT EXISTS logs;

CREATE TABLE logs.caddy_requests (
  ts             DateTime64(3, 'UTC'),
  level          LowCardinality(String),
  logger         LowCardinality(String),
  msg            String,
  remote_ip      String,
  remote_port    UInt16,
  method         LowCardinality(String),
  host           LowCardinality(String),
  uri            String,
  status         UInt16,
  duration_ms    Float32,
  bytes_sent     UInt64,
  user_agent     String,
  err_id         LowCardinality(String),
  err_trace      String
)
ENGINE = MergeTree()
-- 按“年-月”分区,也可改成 toYYYYMMDD(ts) 做日分区
PARTITION BY toYYYYMM(ts)
-- 主键兼排序键
ORDER BY (ts, host, remote_ip)
-- 自动 90 天后清理旧数据(可选)
TTL ts + INTERVAL 90 DAY
SETTINGS index_granularity = 8192;


CREATE DATABASE IF NOT EXISTS logs

Query id: 418c462f-58cd-42d2-af34-192a793ebd92

Ok.

0 rows in set. Elapsed: 0.002 sec.


CREATE TABLE logs.caddy_requests
(
    `ts` DateTime64(3, 'UTC'),
    `level` LowCardinality(String),
    `logger` LowCardinality(String),
    `msg` String,
    `remote_ip` String,
    `remote_port` UInt16,
    `method` LowCardinality(String),
    `host` LowCardinality(String),
    `uri` String,
    `status` UInt16,
    `duration_ms` Float32,
    `bytes_sent` UInt64,
    `user_agent` String,
    `err_id` LowCardinality(String),
    `err_trace` String
)
ENGINE = MergeTree
PARTITION BY toYYYYMM(ts)
ORDER BY (ts, host, remote_ip)
TTL ts + toIntervalDay(90)
SETTINGS index_granularity = 8192

Query id: 91e21c7a-e33a-40fc-a65c-48a35105358b

Ok.

0 rows in set. Elapsed: 0.007 sec.

99dae96430f9 :)
感觉没什么问题。为了验证表存在,结构合理,我运行了:
99dae96430f9 :) -- 列出所有数据库,确认 logs 库存在
SHOW DATABASES;

-- 列出 logs 库中的所有表,确认 caddy_requests 在列
SHOW TABLES FROM logs;

-- 查看表结构,确认各列类型和分区定义
DESCRIBE TABLE logs.caddy_requests;

-- 或者直接看完整的 CREATE TABLE 语句
SHOW CREATE TABLE logs.caddy_requests;


SHOW DATABASES

Query id: 6fa522c4-8e60-4be9-a47c-496e89d8cd97

   ┌─name───────────────┐
1. │ INFORMATION_SCHEMA │
2. │ default            │
3. │ information_schema │
4. │ logs               │
5. │ system             │
   └────────────────────┘

5 rows in set. Elapsed: 0.002 sec.


SHOW TABLES FROM logs

Query id: 4372beac-da98-48c8-94b8-32b653a87a2a

   ┌─name───────────┐
1. │ caddy_requests │
   └────────────────┘

1 row in set. Elapsed: 0.002 sec.


DESCRIBE TABLE logs.caddy_requests

Query id: 8c24a725-5a93-4ec3-9199-6265cb3a60e4

    ┌─name────────┬─type────────────────────────────┬─default_type─┬─default_expression─┬─comment─┬─codec_expression─┬─ttl_expression─┐
 1. │ ts          │ DateTime64(3, 'UTC') │              │                    │         │                  │                │
 2. │ level       │ LowCardinality(String)          │              │                    │         │                  │                │
 3. │ logger      │ LowCardinality(String)          │              │                    │         │                  │                │
 4. │ msg         │ String                          │              │                    │         │                  │                │
 5. │ remote_ip   │ String                          │              │                    │         │                  │                │
 6. │ remote_port │ UInt16                          │              │                    │         │                  │                │
 7. │ method      │ LowCardinality(String)          │              │                    │         │                  │                │
 8. │ host        │ LowCardinality(String)          │              │                    │         │                  │                │
 9. │ uri         │ String                          │              │                    │         │                  │                │
10. │ status      │ UInt16                          │              │                    │         │                  │                │
11. │ duration_ms │ Float32                         │              │                    │         │                  │                │
12. │ bytes_sent  │ UInt64                          │              │                    │         │                  │                │
13. │ user_agent  │ String                          │              │                    │         │                  │                │
14. │ err_id      │ LowCardinality(String)          │              │                    │         │                  │                │
15. │ err_trace   │ String                          │              │                    │         │                  │                │
    └─────────────┴─────────────────────────────────┴──────────────┴────────────────────┴─────────┴──────────────────┴────────────────┘

15 rows in set. Elapsed: 0.001 sec.


SHOW CREATE TABLE logs.caddy_requests

Query id: ff56bcfd-6cd5-4d30-a760-0cca533bdef3

   ┌─statement─────────────────────────────────┐
1. │ CREATE TABLE logs.caddy_requests         ↴│
   │↳(                                        ↴│
   │↳    `ts` DateTime64(3, 'UTC'),↴│
   │↳    `level` LowCardinality(String),      ↴│
   │↳    `logger` LowCardinality(String),     ↴│
   │↳    `msg` String,                        ↴│
   │↳    `remote_ip` String,                  ↴│
   │↳    `remote_port` UInt16,                ↴│
   │↳    `method` LowCardinality(String),     ↴│
   │↳    `host` LowCardinality(String),       ↴│
   │↳    `uri` String,                        ↴│
   │↳    `status` UInt16,                     ↴│
   │↳    `duration_ms` Float32,               ↴│
   │↳    `bytes_sent` UInt64,                 ↴│
   │↳    `user_agent` String,                 ↴│
   │↳    `err_id` LowCardinality(String),     ↴│
   │↳    `err_trace` String                   ↴│
   │↳)                                        ↴│
   │↳ENGINE = MergeTree                       ↴│
   │↳PARTITION BY toYYYYMM(ts)                ↴│
   │↳ORDER BY (ts, host, remote_ip)           ↴│
   │↳TTL ts + toIntervalDay(90)               ↴│
   │↳SETTINGS index_granularity = 8192         │
   └───────────────────────────────────────────┘

1 row in set. Elapsed: 0.001 sec.

99dae96430f9 :)
拿 Python 编写一个简单的采集器
接下来,我认为我们应该专注与将 caddy 的数据写入到 clickhouse 的数据库里。为了做到这件事,我计划使用 Python 来编写一个采集器。
当然,我们也需要给 docker-compose 加个 service。不过在此之前,我们需要先写一个Dockerfile,这个 Dockerfile 将配置 Python 能够从 JSON 中读取日志,并把每行 JSON 转成结构化字段,然后写入 ClickHouse。
等这个 Docker 被编译完了,我们才能将它正式的放入 docker-compose 中。
于是我写下了文件 Dockerfile:
# ===========================
# Build/Runtime in one stage
# ===========================
FROM python:3.12-slim

ENV PYTHONUNBUFFERED=1 \
    PIP_NO_CACHE_DIR=1

RUN apt-get update && apt-get install -y --no-install-recommends \
        curl ca-certificates \
    && rm -rf /var/lib/apt/lists/*

RUN pip install clickhouse-connect==0.7.19 uvloop==0.20.0 watchdog==4.0.1

WORKDIR /app
COPY main.py /app/main.py

# state 目录保存 offset
VOLUME ["/state"]

# 默认环境变量(可在 compose/Swarm 覆盖)
ENV LOG_FILE=/data/caddy/logs/web.log \
    CLICKHOUSE_URL=http://clickhouse:8123 \
    CLICKHOUSE_USER=default \
    CLICKHOUSE_PASSWORD=123456 \
    CLICKHOUSE_DATABASE=logs \
    CLICKHOUSE_TABLE=caddy_requests \
    BATCH_SIZE=1000 \
    FLUSH_INTERVAL_SEC=2

CMD ["python", "/app/main.py"]
同时,我也写下了 main.py 文件,这个 Python 程序就是一条自写的日志 ETL 管道:从 Caddy 的按行 JSON 日志文件里连续 tail(支持轮转),只挑 http.log.access 记录,解析并清洗成固定 15 列(时间、IP、方法、URI、状态码、耗时等),把 Caddy 的浮点时间戳转成本地时区 DateTime64(3),数值字段显式转型,User-Agent 安全取第一项;然后用异步队列批量缓冲,按“条数或时间”触发批量 insert,通过 clickhouse‑connect 写入 ClickHouse。启动时会先查 max(ts) 并二分定位文件偏移,避免重复导入;收到 SIGINT/SIGTERM 会优雅退出并做最后一次 flush。整体目标就是:避免 Vector 复杂度,保持可恢复、低延迟、批量高效、类型稳定。
#!/usr/bin/env python3
import os
import json
import time
import signal
import errno
import threading
import asyncio
from datetime import datetime, timezone
from zoneinfo import ZoneInfo
import logging

import uvloop
from clickhouse_connect import get_client

# === Logging setup ===
logging.basicConfig(level=logging.DEBUG, format='[%(levelname)s] %(asctime)s %(message)s')
logger = logging.getLogger(__name__)

# === Configuration ===
LOG_FILE = os.getenv('LOG_FILE', '/data/caddy/logs/web.log')
CH_URL = os.getenv('CLICKHOUSE_URL', 'http://clickhouse:8123')
CH_USER = os.getenv('CLICKHOUSE_USER', 'default')
CH_PASS = os.getenv('CLICKHOUSE_PASSWORD', '')
CH_DB = os.getenv('CLICKHOUSE_DATABASE', 'logs')
CH_TABLE = os.getenv('CLICKHOUSE_TABLE', 'caddy_requests')
BATCH_SIZE = int(os.getenv('BATCH_SIZE', '1000'))
FLUSH_INTERVAL = float(os.getenv('FLUSH_INTERVAL_SEC', '2'))
TZ = ZoneInfo(os.getenv('TZ', 'UTC'))

# Columns in ClickHouse order
COLUMNS = [
    'ts', 'level', 'logger', 'msg',
    'remote_ip', 'remote_port', 'method', 'host', 'uri',
    'status', 'duration_ms', 'bytes_sent',
    'user_agent', 'err_id', 'err_trace'
]

# Shutdown event
stop_event = threading.Event()


def create_ch_client():
    secure = CH_URL.startswith('https')
    parts = CH_URL.split('://')[-1].split(':')
    host = parts[0]
    port = int(parts[1]) if len(parts) > 1 else 8123
    logger.debug("Creating ClickHouse client to %s:%d (secure=%s)", host, port, secure)
    return get_client(host=host, port=port, username=CH_USER, password=CH_PASS, database=CH_DB, secure=secure)


def get_last_timestamp():
    client = create_ch_client()
    q = f"SELECT max(ts) FROM {CH_DB}.{CH_TABLE}"
    logger.debug("Querying last timestamp with: %s", q)
    res = client.query(q)
    rows = getattr(res, 'result_rows', None)
    if rows and rows[0][0] is not None:
        val = rows[0][0]
        try:
            ts = val.timestamp() if hasattr(val, 'timestamp') else float(val)
            logger.info("Last timestamp in ClickHouse: %s", ts)
            return ts
        except Exception as e:
            logger.error("Failed to parse max(ts) result '%s': %s", val, e)
    logger.info("No existing timestamp found, starting from 0")
    return 0.0


def find_start_offset(path, last_ts):
    logger.debug("Finding start offset in %s for ts > %s", path, last_ts)
    with open(path, 'r', encoding='utf-8', errors='ignore') as f:
        f.seek(0, os.SEEK_END)
        file_size = f.tell()
        low, high, best = 0, file_size, 0
        while low < high:
            mid = (low + high) // 2
            f.seek(mid, os.SEEK_SET)
            f.readline()  # skip partial
            pos = f.tell()
            line = f.readline()
            if not line:
                high = mid
                continue
            try:
                rec = json.loads(line)
                ts_val = float(rec.get('ts', 0.0))
            except Exception:
                low = pos + len(line)
                continue
            if ts_val <= last_ts:
                best = pos + len(line)
                low = best
            else:
                high = mid
        logger.info("Determined start offset: %d", best)
        return best


def to_datetime(ts_float):
    dt_utc = datetime.fromtimestamp(ts_float, tz=timezone.utc)
    return dt_utc.astimezone(TZ)


def extract_first(hdrs, key):
    v = hdrs.get(key)
    if isinstance(v, list):
        return v[0]
    if isinstance(v, str):
        return v
    return ''


def transform(rec):
    logger.debug("Transforming record with ts=%s, logger=%s", rec.get('ts'), rec.get('logger'))
    request = rec.get('request', {}) or {}
    headers = request.get('headers', {}) or {}
    try:
        ts_dt = to_datetime(float(rec.get('ts', 0.0)))
    except Exception:
        ts_dt = datetime.now(TZ)
    duration = rec.get('duration')
    duration_ms = float(duration) * 1000.0 if duration is not None else float(rec.get('duration_ms', 0))
    row = (
        ts_dt,
        str(rec.get('level', '')),
        str(rec.get('logger', '')),
        str(rec.get('msg', '')),
        str(request.get('remote_ip', '')),
        int(request.get('remote_port', 0) or 0),
        str(request.get('method', '')),
        str(request.get('host', '')),
        str(request.get('uri', '')),
        int(rec.get('status', 0) or 0),
        float(duration_ms),
        int(rec.get('size', rec.get('bytes_sent', 0)) or 0),
        str(extract_first(headers, 'User-Agent')),
        str(rec.get('err_id', '')),
        str(rec.get('err_trace', ''))
    )
    logger.debug("Transformed row: %s", row)
    return row


async def flusher(queue):
    client = create_ch_client()
    batch, last_flush = [], time.time()
    while not stop_event.is_set():
        try:
            item = await asyncio.wait_for(queue.get(), timeout=FLUSH_INTERVAL)
            batch.append(item)
            logger.debug("Queued batch size: %d", len(batch))
        except asyncio.TimeoutError:
            pass
        now = time.time()
        if batch and (len(batch) >= BATCH_SIZE or now - last_flush >= FLUSH_INTERVAL):
            try:
                logger.info("Flushing %d rows to ClickHouse", len(batch))
                client.insert(CH_TABLE, batch, column_names=COLUMNS)
            except Exception as e:
                logger.error("Insert failed: %s", e)
            else:
                batch.clear()
                last_flush = now
    if batch:
        try:
            logger.info("Final flush of %d rows", len(batch))
            client.insert(CH_TABLE, batch, column_names=COLUMNS)
        except Exception as e:
            logger.error("Final insert failed: %s", e)


async def reader(queue):
    last_ts = get_last_timestamp()
    logger.info("Starting reader loop")
    start_offset = find_start_offset(LOG_FILE, last_ts)
    f = open(LOG_FILE, 'r', encoding='utf-8', errors='ignore')
    inode = os.fstat(f.fileno()).st_ino
    f.seek(start_offset)
    while not stop_event.is_set():
        line = f.readline()
        if not line:
            try:
                st = os.stat(LOG_FILE)
            except OSError as e:
                if e.errno == errno.ENOENT:
                    await asyncio.sleep(0.5)
                    continue
                else:
                    raise
            if st.st_ino != inode:
                logger.info("Detected log rotation, recalculating start offset")
                f.close()
                start_offset = find_start_offset(LOG_FILE, last_ts)
                f = open(LOG_FILE, 'r', encoding='utf-8', errors='ignore')
                inode = os.fstat(f.fileno()).st_ino
                f.seek(start_offset)
                continue
            await asyncio.sleep(0.2)
            continue
        try:
            rec = json.loads(line)
        except Exception as e:
            logger.warning("Failed to parse JSON line: %s", e)
            continue
        if rec.get('logger') != 'http.log.access':
            continue
        try:
            row = transform(rec)
        except Exception as e:
            logger.error("Transform error: %s", e)
            continue
        await queue.put(row)
        logger.debug("Row queued, timestamp=%s", row[0])


def handle_signal(signum, frame):
    logger.info("Received signal %d, shutting down", signum)
    stop_event.set()


def main():
    signal.signal(signal.SIGTERM, handle_signal)
    signal.signal(signal.SIGINT, handle_signal)
    uvloop.install()
    loop = asyncio.get_event_loop()
    queue = asyncio.Queue(maxsize=50000)
    tasks = [
        loop.create_task(reader(queue)),
        loop.create_task(flusher(queue)),
    ]
    try:
        loop.run_until_complete(asyncio.gather(*tasks))
    finally:
        for t in tasks:
            t.cancel()
        loop.stop()
        loop.close()


if __name__ == '__main__':
    main()
使用采集器将 Caddy 的日志采集到 Clickhouse
当我准备完 Vector 这个容器了以后,是时候将它加入到我的 docker-compose.yml 里了!
此时三个关键的 service 定义如下:
version: '3.9'

services:
  sites:
    image: localhost:8080/box_starting/local_sites
    ports:
      # These ports are for internal use. For external, FRP will handle it.
      - target: 80
        published: 80
        protocol: tcp
        mode: host
      - target: 443
        published: 443
        protocol: tcp
        mode: host
    networks:
      - frp_net
      - proxy_app
    volumes:
      - sites-data:/data
    stop_grace_period: 60s
    deploy:
      resources:
        limits:
          cpus: '8.0'
          memory: 16G
      update_config:
        order: stop-first
        delay: 60s

  clickhouse:
    image: hub.aiursoft.cn/clickhouse/clickhouse-server:latest
    environment:
      - CLICKHOUSE_USER=default
      - CLICKHOUSE_PASSWORD=123456
    networks:
      - internal
    volumes:
      - click-house-data:/var/lib/clickhouse
    stop_grace_period: 60s
    deploy:
      resources:
        limits:
          cpus: '4.0'
          memory: 8G
      update_config:
        order: stop-first
        delay: 60s

  pysyncer:
    image: localhost:8080/box_starting/local_pysyncer
    depends_on:
      - clickhouse
    networks:
      - internal
    volumes:
      - sites-data:/data:ro
    stop_grace_period: 60s
    deploy:
      resources:
        limits:
          cpus: '1.0'
          memory: 1G
      update_config:
        order: stop-first
        delay: 60s
继续之前,我们先复习一下 caddy 的log文件的样式:
anduin@proart:/swarm-vol/Box$ cd /swarm-vol/sites-data/
anduin@proart:/swarm-vol/sites-data$ ls
caddy
anduin@proart:/swarm-vol/sites-data$ cd caddy/logs/
anduin@proart:/swarm-vol/sites-data/caddy/logs$ ls
web.log
anduin@proart:/swarm-vol/sites-data/caddy/logs$ tail -n 20 ./web.log
tail: cannot open './web.log' for reading: Permission denied
anduin@proart:/swarm-vol/sites-data/caddy/logs$ sudo tail -n 20 ./web.log
{"level":"info","ts":1753607471.3656464,"logger":"http.log.access","msg":"handled request","request":{"remote_ip":"52.81.114.99","remote_port":"50108","client_ip":"52.81.114.99","proto":"HTTP/2.0","method":"POST","host":"gitlab.aiursoft.cn","uri":"/api/graphql","headers":{"Accept":["*/*"],"Content-Type":["application/json"],"Accept-Language":["zh,zh-CN;q=0.9"],"Accept-Encoding":["gzip, deflate, br"],"Content-Length":["2034"],"User-Agent":["Mozilla/5.0 (Macintosh; Intel Mac OS X 10_14_0) AppleWebKit/537.36 (KHTML, like Gecko) Chrome/60.0.5232.1704 Safari/537.36"],"Sec-Fetch-Dest":["empty"],"X-Csrf-Token":["3KmgeS9sfn-Nc9rEiGp9Om810EuS-zUlqjEG6Nimm1abwyEf4J74xYV2OEbm96o1UBxsgur_Nn9Hn0ePxO6WzA"],"X-Gitlab-Feature-Category":["source_code_management"],"Sec-Fetch-Mode":["cors"],"Origin":["https://gitlab.aiursoft.cn"],"Sec-Fetch-Site":["same-origin"],"Referer":["https://gitlab.aiursoft.cn/edgeneko/transformers/-/blob/a0857740c0e6127485c11476650314df3accc2b6/src/transformers/models/patchtsmixer/modeling_patchtsmixer.py"],"Cookie":["REDACTED"]},"tls":{"resumed":false,"version":772,"cipher_suite":4865,"proto":"h2","server_name":"gitlab.aiursoft.cn"}},"bytes_read":2034,"user_id":"","duration":0.146402042,"size":1840,"status":200,"resp_headers":{"X-Permitted-Cross-Domain-Policies":["none"],"X-Content-Type-Options":["nosniff"],"X-Frame-Options":["SAMEORIGIN"],"Content-Security-Policy":[""],"Via":["1.1 Caddy"],"Access-Control-Allow-Origin":["https://gitlab.aiursoft.cn"],"Nel":["{\"max_age\": 0}"],"Server":["nginx"],"Access-Control-Expose-Headers":["Link, X-Total, X-Total-Pages, X-Per-Page, X-Page, X-Next-Page, X-Prev-Page, X-Gitlab-Blob-Id, X-Gitlab-Commit-Id, X-Gitlab-Content-Sha256, X-Gitlab-Encoding, X-Gitlab-File-Name, X-Gitlab-File-Path, X-Gitlab-Last-Commit-Id, X-Gitlab-Ref, X-Gitlab-Size, X-Request-Id, ETag"],"Etag":["W/\"32190250e9efca1b52f562aebee5a31f\""],"X-Download-Options":["noopen"],"X-Ua-Compatible":["IE=edge"],"Permissions-Policy":["interest-cohort=()"],"Vary":["Accept-Encoding","Accept, Origin"],"X-Runtime":["0.113391"],"Referrer-Policy":["strict-origin-when-cross-origin"],"X-Gitlab-Meta":["{\"correlation_id\":\"01K15JD04HXEXJ5RW0ERVCN3FD\",\"version\":\"1\"}"],"Content-Type":["application/json; charset=utf-8"],"Date":["Sun, 27 Jul 2025 09:11:11 GMT"],"X-Request-Id":["01K15JD04HXEXJ5RW0ERVCN3FD"],"Access-Control-Allow-Credentials":["true"],"Cache-Control":["max-age=0, private, must-revalidate"],"X-Xss-Protection":["1; mode=block"],"Access-Control-Allow-Methods":["GET, HEAD, POST, PUT, PATCH, DELETE, OPTIONS"],"Alt-Svc":["h3=\":443\"; ma=2592000"],"Strict-Transport-Security":["max-age=63072000","max-age=63072000"],"Content-Encoding":["gzip"],"Access-Control-Max-Age":["7200"]}}
{"level":"debug","ts":1753607471.3894894,"logger":"http.handlers.reverse_proxy","msg":"selected upstream","dial":"gitlab_gitlab:80","total_upstreams":1}
{"level":"debug","ts":1753607471.4118912,"logger":"http.handlers.reverse_proxy","msg":"selected upstream","dial":"gitlab_gitlab:80","total_upstreams":1}
{"level":"debug","ts":1753607471.4228811,"logger":"http.handlers.reverse_proxy","msg":"upstream roundtrip","upstream":"gitlab_gitlab:80","duration":0.033285786,"request":{"remote_ip":"52.81.114.99","remote_port":"50108","client_ip":"52.81.114.99","proto":"HTTP/2.0","method":"POST","host":"gitlab.aiursoft.cn","uri":"/-/collect_events","headers":{"Accept-Encoding":["gzip, deflate, br"],"Accept":["*/*"],"Content-Length":["2739"],"Sec-Fetch-Site":["same-origin"],"Sec-Fetch-Mode":["cors"],"Referer":["https://gitlab.aiursoft.cn/edgeneko/transformers/-/blob/a0857740c0e6127485c11476650314df3accc2b6/src/transformers/models/patchtsmixer/modeling_patchtsmixer.py"],"X-Forwarded-Proto":["https"],"Cookie":["REDACTED"],"Origin":["https://gitlab.aiursoft.cn"],"Sec-Fetch-Dest":["empty"],"User-Agent":["Mozilla/5.0 (Macintosh; Intel Mac OS X 10_14_0) AppleWebKit/537.36 (KHTML, like Gecko) Chrome/60.0.5232.1704 Safari/537.36"],"X-Forwarded-For":["52.81.114.99"],"X-Forwarded-Host":["gitlab.aiursoft.cn"],"Content-Type":["application/json; charset=UTF-8"],"Accept-Language":["zh,zh-CN;q=0.9"],"Via":["2.0 Caddy"]},"tls":{"resumed":false,"version":772,"cipher_suite":4865,"proto":"h2","server_name":"gitlab.aiursoft.cn"}},"headers":{"Date":["Sun, 27 Jul 2025 09:11:11 GMT"],"Connection":["keep-alive"],"Cache-Control":["no-cache"],"X-Frame-Options":["SAMEORIGIN"],"X-Gitlab-Meta":["{\"correlation_id\":\"01K15JD09MW83H4ECSDB3F0W2H\",\"version\":\"1\"}"],"X-Permitted-Cross-Domain-Policies":["none"],"X-Request-Id":["01K15JD09MW83H4ECSDB3F0W2H"],"Content-Security-Policy":[""],"X-Download-Options":["noopen"],"X-Runtime":["0.008243"],"Content-Type":["text/html"],"X-Xss-Protection":["0"],"Strict-Transport-Security":["max-age=63072000"],"Referrer-Policy":["strict-origin-when-cross-origin"],"Server":["nginx"],"Content-Length":["0"],"Nel":["{\"max_age\": 0}"],"X-Content-Type-Options":["nosniff"]},"status":200}
上面 caddy 的日志,要重点理解:它不是标准的JSON格式,而是每行都是一个 JSON。必须一行一行的读。如果整个文件一起反序列化就完蛋了。而且随着请求抵达,都会不停给它追加新的行。
实际部署了上面的容器以后,工作非常良好。
anduin@proart:/swarm-vol/Box$ sudo docker ps | grep incoming
12c0c00c8bc1   localhost:8080/box_starting/local_pysyncer:latest                                "python /app/main.py"     19 seconds ago      Up 14 seconds                                                                                                               incoming_pysyncer.1.zcri465vte59q7ykcvkazicmz
3e2644ae35e8   hub.aiursoft.cn/clickhouse/clickhouse-server:latest                              "/entrypoint.sh"          25 seconds ago      Up 16 seconds          8123/tcp, 9000/tcp, 9009/tcp                                                                         incoming_clickhouse.1.g78dnhblb5lo47a3r4slpwlud
b9dbeec4c2e4   localhost:8080/box_starting/local_sites:latest                                   "sh -c 'caddy run --…"    2 hours ago         Up 2 hours             0.0.0.0:80->80/tcp, [::]:80->80/tcp, 0.0.0.0:443->443/tcp, [::]:443->443/tcp, 443/udp, 2019/tcp      incoming_sites.1.tchujhi57vpj5h54yb6cvhot0
cd64d810cd87   localhost:8080/box_starting/local_frp:latest                                     "sh -c /entrypoint.sh"    2 days ago          Up 2 days                                                                                                                   incoming_frpc_ningbo.1.sizoca54zijta6fl4f7d6atc0
8038df1ff221   localhost:8080/box_starting/local_frp:latest                                     "sh -c /entrypoint.sh"    2 days ago          Up 2 days                                                                                                                   incoming_frpc_jp.1.cbuf8m2wdfr7qoms9wd9a9jdb
anduin@proart:/swarm-vol/Box$ sudo docker logs -f 12c0c00c8bc1
/app/main.py:226: DeprecationWarning: There is no current event loop
  loop = asyncio.get_event_loop()
[DEBUG] 2025-07-27 10:32:39,699 Creating ClickHouse client to clickhouse:8123 (secure=False)
[DEBUG] 2025-07-27 10:32:39,711 Querying last timestamp with: SELECT max(ts) FROM logs.caddy_requests
[INFO] 2025-07-27 10:32:39,720 Last timestamp in ClickHouse: 1753612350.828
[INFO] 2025-07-27 10:32:39,720 Starting reader loop
[DEBUG] 2025-07-27 10:32:39,720 Finding start offset in /data/caddy/logs/web.log for ts > 1753612350.828
[INFO] 2025-07-27 10:32:39,720 Determined start offset: 139816254
[DEBUG] 2025-07-27 10:32:39,720 Transforming record with ts=1753612350.8285708, logger=http.log.access
[DEBUG] 2025-07-27 10:32:39,720 Transformed row: (datetime.datetime(2025, 7, 27, 10, 32, 30, 828571, tzinfo=zoneinfo.ZoneInfo(key='UTC')), 'info', 'http.log.access', 'handled request', '51.222.253.18', 43610, 'GET', 'nuget.aiursoft.cn', '/packages/microsoft.extensions.caching.stackexchangeredis/9.0.6', 200, 905.742426, 6435, 'Mozilla/5.0 (compatible; AhrefsBot/7.0; +http://ahrefs.com/robot/)', '', '')
[DEBUG] 2025-07-27 10:32:39,720 Row queued, timestamp=2025-07-27 10:32:30.828571+00:00
[DEBUG] 2025-07-27 10:32:39,720 Transforming record with ts=1753612350.8735032, logger=http.log.access
在 Clickhouse 里检查采集到的结构化数据
我们可以去 ClickHouse 里查询一下,看看数据是否正常:
anduin@proart:~$ sudo docker ps | grep clickhouse
3e2644ae35e8   hub.aiursoft.cn/clickhouse/clickhouse-server:latest                              "/entrypoint.sh"          4 minutes ago       Up 4 minutes           8123/tcp, 9000/tcp, 9009/tcp                                                                         incoming_clickhouse.1.g78dnhblb5lo47a3r4slpwlud
anduin@proart:~$ sudo docker exec -it 3e2644ae35e8  clickhouse-client --user default
ClickHouse client version 25.6.4.12 (official build).
Connecting to localhost:9000 as user default.
Connected to ClickHouse server version 25.6.4.

Warnings:
 * Delay accounting is not enabled, OSIOWaitMicroseconds will not be gathered. You can enable it using `echo 1 > /proc/sys/kernel/task_delayacct` or by using sysctl.

3e2644ae35e8 :)
接下来,可以先看看数据有多少:
3e2644ae35e8 :) SELECT count() FROM logs.caddy_requests;

SELECT count()
FROM logs.caddy_requests

Query id: 52567be0-23f9-46d6-896f-04166b1d6fa7

   ┌─count()─┐
1. │   38177 │
   └─────────┘

1 row in set. Elapsed: 0.004 sec.
看看最近的 HTTP 请求:
3e2644ae35e8 :) SELECT ts, level, logger, msg, remote_ip, remote_port, method, host, status, duration_ms, bytes_sent, uri
FROM logs.caddy_requests
ORDER BY ts DESC
LIMIT 30
FORMAT Pretty;

SELECT
    ts,
    level,
    logger,
    msg,
    remote_ip,
    remote_port,
    method,
    host,
    status,
    duration_ms,
    bytes_sent,
    uri
FROM logs.caddy_requests
ORDER BY ts DESC
LIMIT 30
FORMAT Pretty

Query id: 334414e5-7810-4e3e-8cda-7140480d9ed2

    ┏━━━━━━━━━━━━━━━━━━━━━━━━━┳━━━━━━━┳━━━━━━━━━━━━━━━━━┳━━━━━━━━━━━━━━━━━┳━━━━━━━━━━━━━━━━━━━━━━━━━━━━━━━━━━━━━━━┳━━━━━━━━━━━━━┳━━━━━━━━━━┳━━━━━━━━━━━━━━━━━━━━━━━━━━━━━━━━━┳━━━━━━━━┳━━━━━━━━━━━━━┳━━━━━━━━━━━━┳━━━━━━━━━━━━━━━━━━━━━━━━━━━━━━━━━━━━━━━━━━━━━━━━━━━━━━━━━━━━━━━━━━━━━━━━━━━━━━━━━━━━━━━━━━━━━━━━━━━━━━━┓
    ┃                       ts ┃ level ┃ logger          ┃ msg             ┃ remote_ip                             ┃ remote_port ┃ method   ┃ host                            ┃ status ┃ duration_ms ┃ bytes_sent ┃ uri                                                                                                   ┃
    ┡━━━━━━━━━━━━━━━━━━━━━━━━━╇━━━━━━━╇━━━━━━━━━━━━━━━━━╇━━━━━━━━━━━━━━━━━╇━━━━━━━━━━━━━━━━━━━━━━━━━━━━━━━━━━━━━━━╇━━━━━━━━━━━━━╇━━━━━━━━━━╇━━━━━━━━━━━━━━━━━━━━━━━━━━━━━━━━━╇━━━━━━━━╇━━━━━━━━━━━━━╇━━━━━━━━━━━━╇━━━━━━━━━━━━━━━━━━━━━━━━━━━━━━━━━━━━━━━━━━━━━━━━━━━━━━━━━━━━━━━━━━━━━━━━━━━━━━━━━━━━━━━━━━━━━━━━━━━━━━━┩
    ├─────────────────────────┼───────┼─────────────────┼─────────────────┼───────────────────────────────────────┼─────────────┼──────────┼─────────────────────────────────┼────────┼─────────────┼────────────┼───────────────────────────────────────────────────────────────────────────────────────────────────────┤
20. │ 2025-07-27 18:37:56.431 │ info  │ http.log.access │ handled request │ 222.222.222.222                       │       43734 │ POST     │ stathub.aiursoft.cn             │    201 │    0.911467 │         56 │ /api/metrics                                                                                          │
    ├─────────────────────────┼───────┼─────────────────┼─────────────────┼───────────────────────────────────────┼─────────────┼──────────┼─────────────────────────────────┼────────┼─────────────┼────────────┼───────────────────────────────────────────────────────────────────────────────────────────────────────┤
21. │ 2025-07-27 18:37:56.374 │ info  │ http.log.access │ handled request │ 222.222.222.222                       │       52612 │ GET      │ gitlab.aiursoft.cn              │    404 │    44.58619 │         27 │ /api/v4/projects/anduin%2Fanduinos-docs/releases/permalink/latest                                     │
    ├─────────────────────────┼───────┼─────────────────┼─────────────────┼───────────────────────────────────────┼─────────────┼──────────┼─────────────────────────────────┼────────┼─────────────┼────────────┼───────────────────────────────────────────────────────────────────────────────────────────────────────┤
22. │ 2025-07-27 18:37:56.370 │ info  │ http.log.access │ handled request │ 222.222.222.222                       │       52612 │ GET      │ gitlab.aiursoft.cn              │    200 │    36.16609 │        430 │ /api/v4/projects/anduin%2Fanduinos-docs                                                               │
    ├─────────────────────────┼───────┼─────────────────┼─────────────────┼───────────────────────────────────────┼─────────────┼──────────┼─────────────────────────────────┼────────┼─────────────┼────────────┼───────────────────────────────────────────────────────────────────────────────────────────────────────┤
23. │ 2025-07-27 18:37:56.344 │ info  │ http.log.access │ handled request │ 222.222.222.222                       │       42668 │ POST     │ gitlab.aiursoft.cn              │    204 │    2.366945 │          0 │ /api/v4/jobs/request                                                                                  │
    ├─────────────────────────┼───────┼─────────────────┼─────────────────┼───────────────────────────────────────┼─────────────┼──────────┼─────────────────────────────────┼────────┼─────────────┼────────────┼───────────────────────────────────────────────────────────────────────────────────────────────────────┤
24. │ 2025-07-27 18:37:55.762 │ info  │ http.log.access │ handled request │ 222.222.222.222                       │       49907 │ PROPFIND │ nextcloud.aiursoft.cn           │    207 │    47.25869 │        254 │ /remote.php/dav/files/angelwing32/                                                                    │
    ├─────────────────────────┼───────┼─────────────────┼─────────────────┼───────────────────────────────────────┼─────────────┼──────────┼─────────────────────────────────┼────────┼─────────────┼────────────┼───────────────────────────────────────────────────────────────────────────────────────────────────────┤
25. │ 2025-07-27 18:37:55.738 │ info  │ http.log.access │ handled request │ 222.222.222.222                       │       39766 │ POST     │ stathub.aiursoft.cn             │    201 │    0.807904 │         56 │ /api/metrics                                                                                          │
    ├─────────────────────────┼───────┼─────────────────┼─────────────────┼───────────────────────────────────────┼─────────────┼──────────┼─────────────────────────────────┼────────┼─────────────┼────────────┼───────────────────────────────────────────────────────────────────────────────────────────────────────┤
26. │ 2025-07-27 18:37:55.497 │ info  │ http.log.access │ handled request │ 222.222.222.222                       │       56234 │ HEAD     │ hub.aiursoft.cn                 │    200 │    3.154572 │          0 │ /v2/anduin/anduinos-docs/manifests/latest                                                             │
    ├─────────────────────────┼───────┼─────────────────┼─────────────────┼───────────────────────────────────────┼─────────────┼──────────┼─────────────────────────────────┼────────┼─────────────┼────────────┼───────────────────────────────────────────────────────────────────────────────────────────────────────┤
27. │ 2025-07-27 18:37:55.319 │ info  │ http.log.access │ handled request │ 222.222.222.222                       │       37020 │ GET      │ dashboard.inventory.aiursoft.cn │    308 │    0.019892 │          0 │ /assets/js/kcfinder/upload.php                                                                        │
    ├─────────────────────────┼───────┼─────────────────┼─────────────────┼───────────────────────────────────────┼─────────────┼──────────┼─────────────────────────────────┼────────┼─────────────┼────────────┼───────────────────────────────────────────────────────────────────────────────────────────────────────┤
28. │ 2025-07-27 18:37:54.759 │ info  │ http.log.access │ handled request │ 222.222.222.222                       │       57226 │ POST     │ stathub.aiursoft.cn             │    201 │    1.095069 │         56 │ /api/metrics                                                                                          │
    ├─────────────────────────┼───────┼─────────────────┼─────────────────┼───────────────────────────────────────┼─────────────┼──────────┼─────────────────────────────────┼────────┼─────────────┼────────────┼───────────────────────────────────────────────────────────────────────────────────────────────────────┤
29. │ 2025-07-27 18:37:54.672 │ info  │ http.log.access │ handled request │ 222.222.222.222                       │       36668 │ POST     │ stathub.aiursoft.cn             │    201 │     0.99698 │         56 │ /api/metrics                                                                                          │
    ├─────────────────────────┼───────┼─────────────────┼─────────────────┼───────────────────────────────────────┼─────────────┼──────────┼─────────────────────────────────┼────────┼─────────────┼────────────┼───────────────────────────────────────────────────────────────────────────────────────────────────────┤
30. │ 2025-07-27 18:37:54.393 │ info  │ http.log.access │ handled request │ 222.222.222.222                       │       40810 │ POST     │ stathub.aiursoft.cn             │    201 │    1.495005 │         56 │ /api/metrics                                                                                          │
    └─────────────────────────┴───────┴─────────────────┴─────────────────┴───────────────────────────────────────┴─────────────┴──────────┴─────────────────────────────────┴────────┴─────────────┴────────────┴───────────────────────────────────────────────────────────────────────────────────────────────────────┘

30 rows in set. Elapsed: 0.004 sec. Processed 3.24 thousand rows, 407.31 KB (742.98 thousand rows/s., 93.37 MB/s.)
Peak memory usage: 1008.68 KiB.
可以看到,非常的完美。
写好几个最常用的我需要的数据的查询
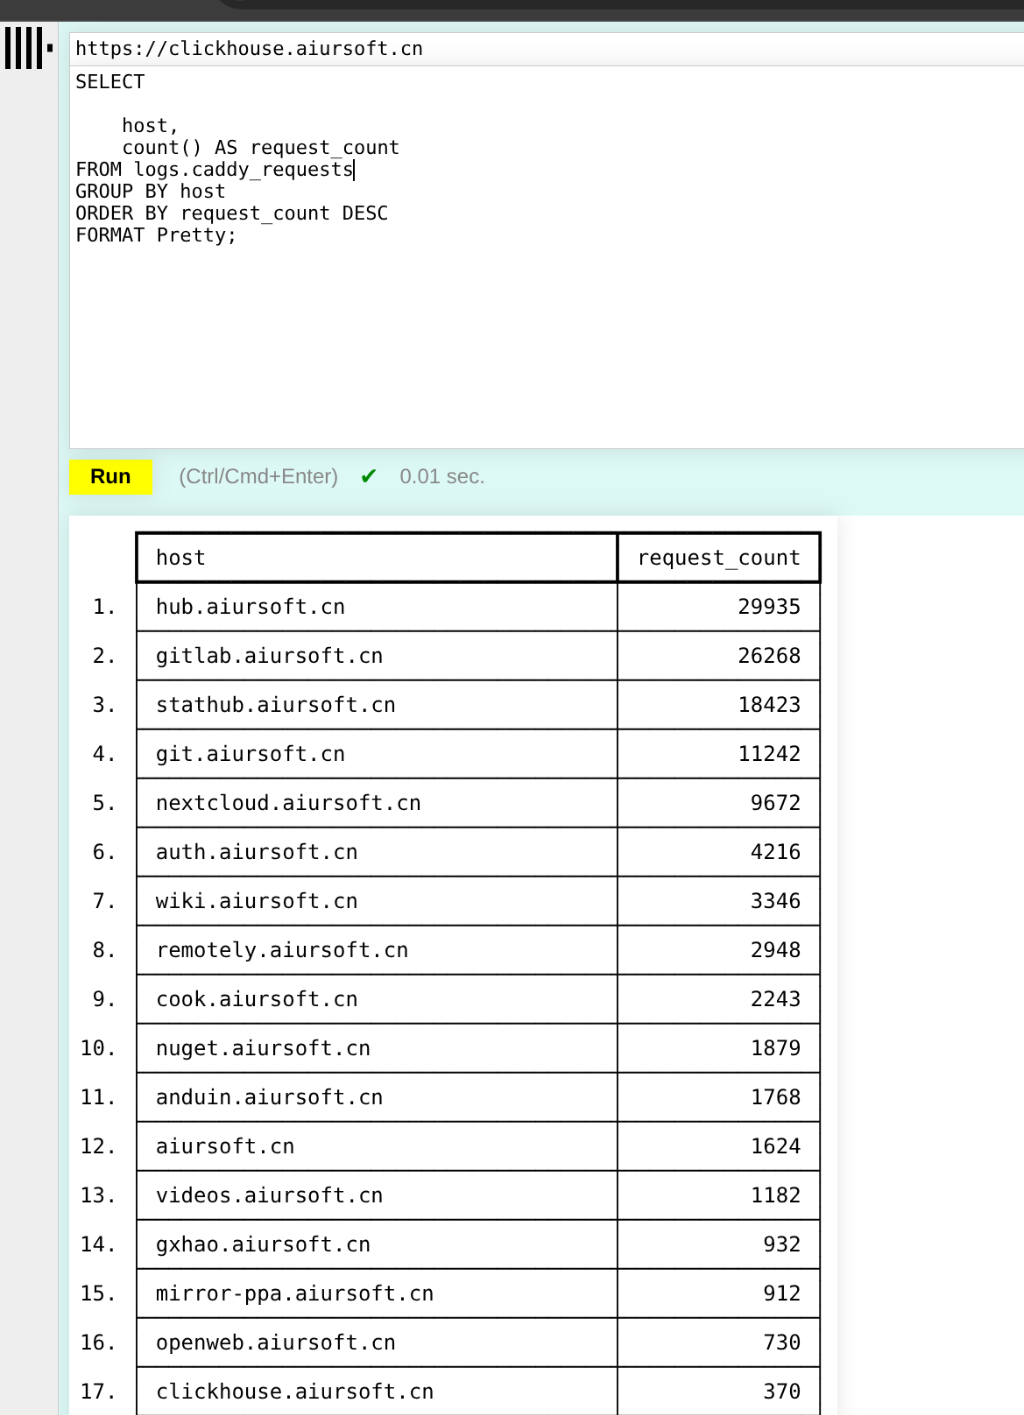
我也可以做点儿别的,比如各个业务按请求数量排名:
SELECT
    host,
    count() AS request_count
FROM logs.caddy_requests
GROUP BY host
ORDER BY request_count DESC
FORMAT Pretty;
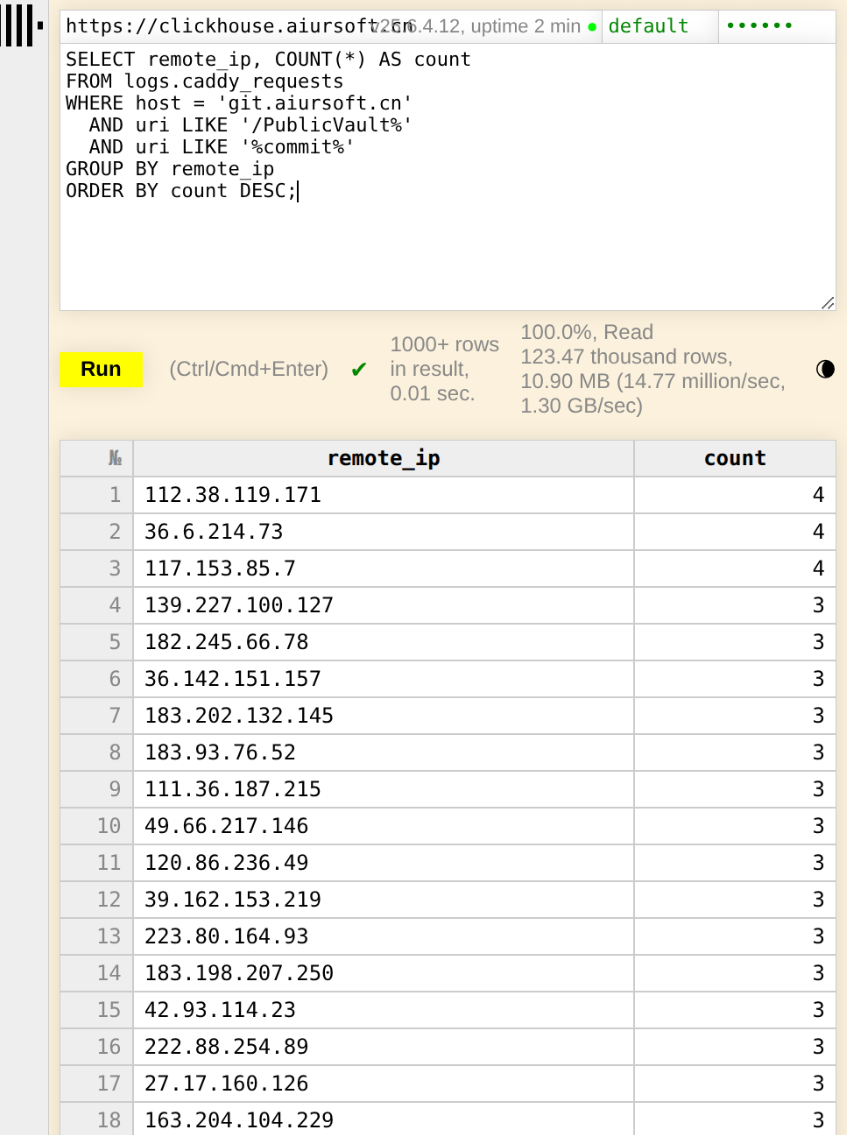
我也可以快速的抓到正在爬我家数据的爬虫:
SELECT remote_ip, COUNT(*) AS count
FROM logs.caddy_requests
WHERE host = 'git.aiursoft.cn'
  AND uri LIKE '/PublicVault%'
  AND uri LIKE '%commit%'
GROUP BY remote_ip
ORDER BY count DESC;
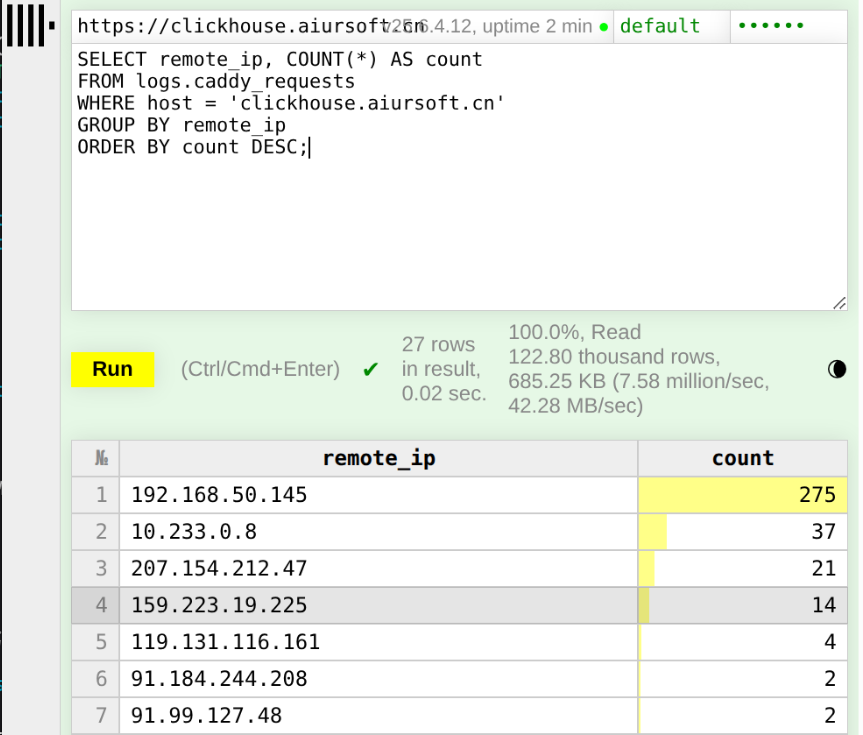
我也可以快速的看到一个业务(host)具体都是哪些IP在用:
SELECT remote_ip, COUNT(*) AS count
FROM logs.caddy_requests
WHERE host = 'clickhouse.aiursoft.cn'
GROUP BY remote_ip
ORDER BY count DESC;
TOP 100 最热业务排名,各个host的请求数,按独立的IP数来排名:
SELECT
    host,
    uniqExact(remote_ip) AS unique_ip_count
FROM logs.caddy_requests
GROUP BY host
ORDER BY unique_ip_count DESC
LIMIT 100;
TOP 100 最烧CPU的业务排名,也就是各个hosts的总请求消耗的时间:
SELECT
    host,
    sum(duration_ms)       AS total_duration_ms,
    count()                AS requests
FROM logs.caddy_requests
GROUP BY host
ORDER BY total_duration_ms DESC
LIMIT 100;
TOP 100 最热接口,请求数最多的接口。
SELECT
    host,
    splitByChar('?', uri)[1] AS path,
    count()                   AS requests
FROM logs.caddy_requests
GROUP BY
    host,
    path
ORDER BY
    requests DESC
LIMIT 100;
Top 100 错误接口 / 错误码排行,找出失败最集中的接口或最常见的 4xx/5xx 状态:
SELECT
    host,
    uri,
    status,
    count() AS errors
FROM logs.caddy_requests
WHERE 1=1
  AND status >= 400
GROUP BY
    host,
    uri,
    status
ORDER BY
    errors DESC
LIMIT 100;
Top 100 缓慢接口,如果以平均值:
SELECT
    host,
    splitByChar('?', uri)[1] AS path,
    avg(duration_ms)             AS avg_response_time_ms,
    count()                      AS requests
FROM logs.caddy_requests WHERE status != '101'
GROUP BY
    host,
    path
ORDER BY
    avg_response_time_ms DESC
LIMIT 100;
Top 100 缓慢接口,如果以 P95:
SELECT
    host,
    splitByChar('?', uri)[1] AS path,
    quantile(0.95)(duration_ms) AS p95_response_time_ms,
    count()                     AS requests
FROM logs.caddy_requests WHERE status != '101'
GROUP BY
    host,
    path
ORDER BY
    p95_response_time_ms DESC
LIMIT 100;
P95 / P99 响应时延趋势。除了平均值,P95(95% 分位)和 P99 更能反映“尾部”延迟:
SELECT
 toStartOfInterval(ts, INTERVAL {rounding:UInt32} SECOND) AS t,
 quantile(0.95)(duration_ms) AS p95_latency_ms,
 quantile(0.99)(duration_ms) AS p99_latency_ms
FROM logs.caddy_requests
WHERE ts >= now() - {seconds:UInt32}
GROUP BY t
ORDER BY t
WITH FILL STEP {rounding:UInt32}
请求大小 P95 / P50 分布,用分位数查看响应体大小的分布:
SELECT
 toStartOfInterval(ts, INTERVAL {rounding:UInt32} SECOND) AS t,
 quantile(0.5)(bytes_sent)  AS p50_bytes,
 quantile(0.95)(bytes_sent) AS p95_bytes
FROM logs.caddy_requests
WHERE ts >= now() - {seconds:UInt32}
GROUP BY t
ORDER BY t
WITH FILL STEP {rounding:UInt32}
按“星期几+小时”请求热力图,观察一周内、一天各时段的流量高峰:
SELECT
 toDayOfWeek(ts)    AS weekday,  -- 1=Monday … 7=Sunday
 toHour(ts)         AS hour,
 count()            AS cnt
FROM logs.caddy_requests
WHERE ts >= now() - {seconds:UInt32}
GROUP BY weekday, hour
ORDER BY weekday, hour
User‑Agent 分布,查看都有哪些调用方(浏览器、爬虫、脚本……)在访问你的服务:
SELECT
 user_agent,
 count() AS cnt
FROM logs.caddy_requests
WHERE ts >= now() - {seconds:UInt32}
GROUP BY user_agent
ORDER BY cnt DESC
LIMIT 10
这些可视化能帮助你从不同角度(最热接口、尾部延迟、时段流量、错误聚集、客户端类型)深入了解服务运行状况和潜在瓶颈。
现在,我们已经成功地将 Caddy 的日志数据从文件中读取,并将其转换为 ClickHouse 可用的格式。接下来,我们可以使用 Superset 或其他可视化工具来分析这些数据,生成各种报表和图表。
调查黑客的洪流攻击
刚好有一波黑客正在攻击我,我借助刚建设好的数据库,顺便查询一下这波攻击的方式:
明白了,这里的时间窗口就是 UTC,不需要再做时区转换,直接用以下 SQL:
1. 按业务统计请求数(降序,UTC 2025‑07‑27 14:35–14:45)
SELECT
    host,
    count() AS requests
FROM logs.caddy_requests
WHERE ts BETWEEN
      toDateTime('2025-07-27 14:35:00','UTC')
  AND toDateTime('2025-07-27 14:45:00','UTC')
GROUP BY host
ORDER BY requests DESC;
2. 每 10 秒粒度的流量总大小(UTC 2025‑07‑27 14:35–14:45)
SELECT
    toStartOfInterval(ts, INTERVAL 10 SECOND) AS t,
    sum(bytes_sent) AS total_bytes
FROM logs.caddy_requests
WHERE ts BETWEEN
      toDateTime('2025-07-27 14:35:00','UTC')
  AND toDateTime('2025-07-27 14:45:00','UTC')
GROUP BY t
ORDER BY t;
3. 按请求数逆序的客户端 IP 列表及对应主机(UTC 2025‑07‑27 14:35–14:45)
SELECT
    remote_ip,
    host,
    count() AS requests
FROM logs.caddy_requests
WHERE ts BETWEEN
      toDateTime('2025-07-27 14:35:00','UTC')
  AND toDateTime('2025-07-27 14:45:00','UTC')
GROUP BY remote_ip, host
ORDER BY requests DESC;
4. 状态码分布(UTC 2025‑07‑27 14:35–14:45)
SELECT
    status,
    count() AS count
FROM logs.caddy_requests
WHERE ts BETWEEN
      toDateTime('2025-07-27 14:35:00','UTC')
  AND toDateTime('2025-07-27 14:45:00','UTC')
GROUP BY status
ORDER BY count DESC;
5. URI 前 20 字符前缀分布(降序,UTC 2025‑07‑27 14:35–14:45)
SELECT
    substring(uri, 1, 20) AS path_prefix,
    count()               AS count
FROM logs.caddy_requests
WHERE ts BETWEEN
      toDateTime('2025-07-27 14:35:00','UTC')
  AND toDateTime('2025-07-27 14:45:00','UTC')
GROUP BY path_prefix
ORDER BY count DESC;
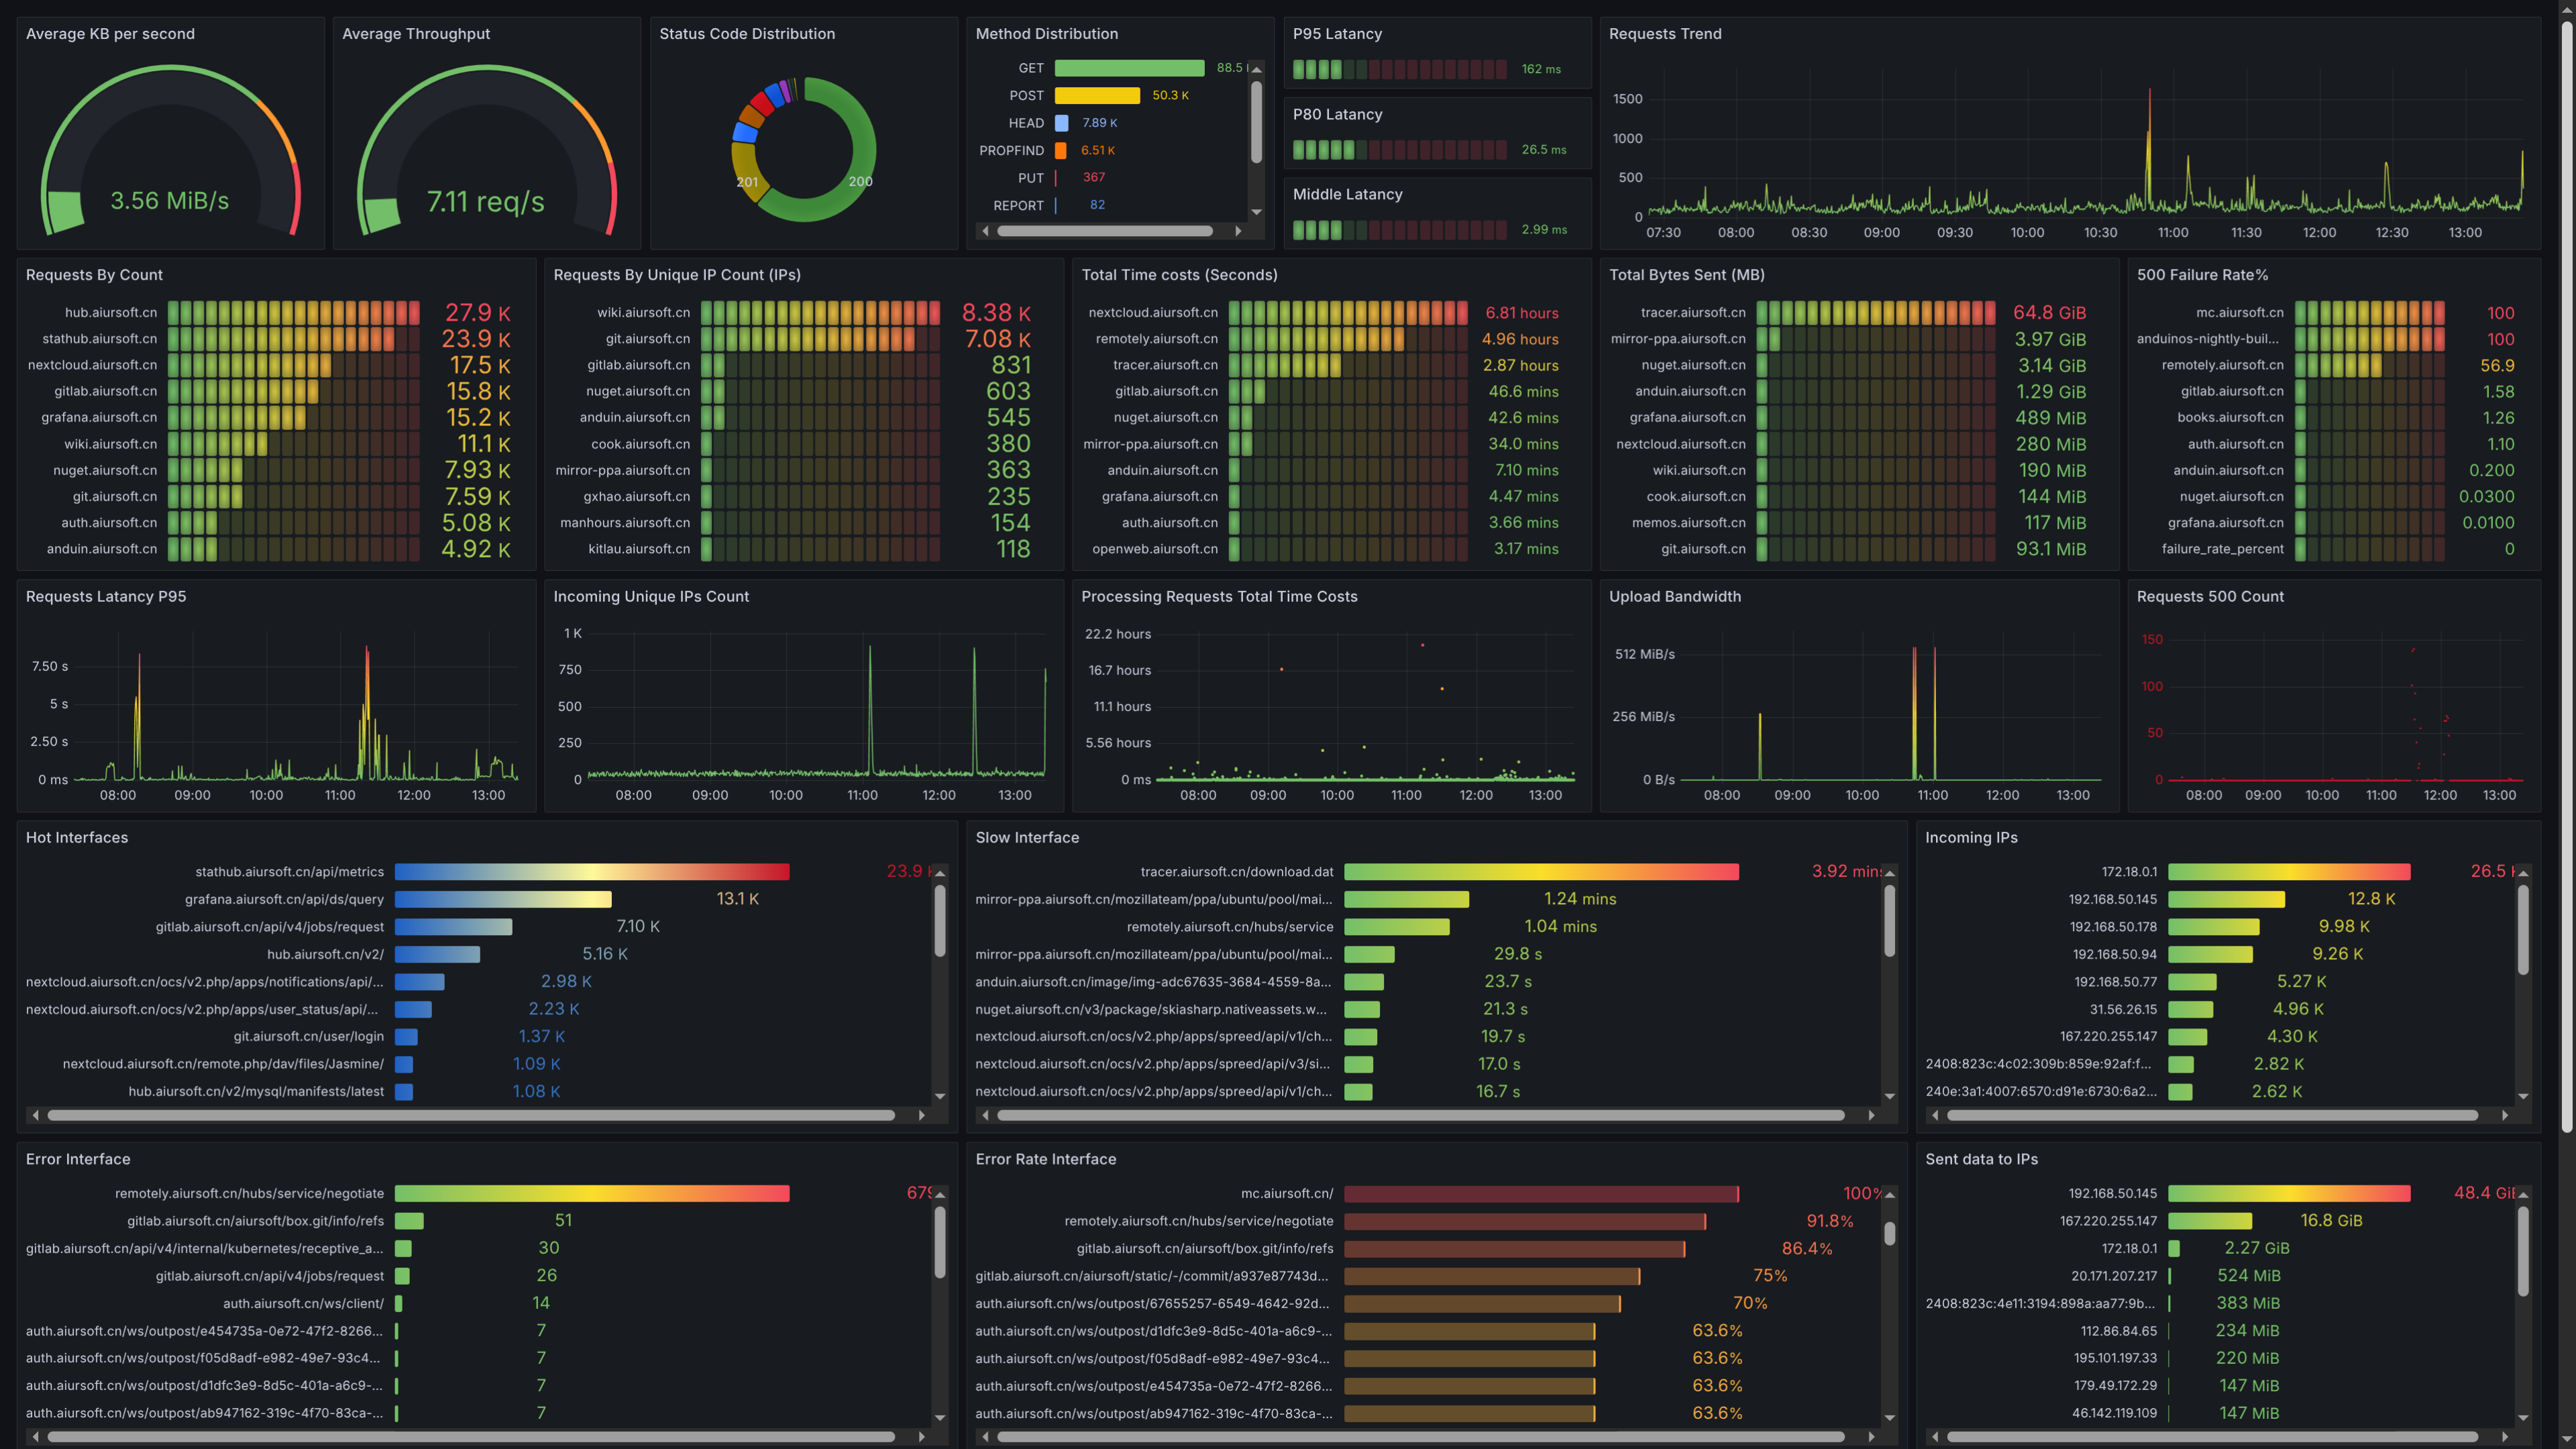
搓个漂亮的仪表板
Clickhouse 这个数据库自带一个仪表板。把上面的 SQL 整理整理,不难得到一个非常漂亮的仪表板。
Grafana
借助 Grafana,还可以搓出更漂亮的仪表板。
结论
如果需要继续可视化,还可以使用 Apache Superset。不过可视化到这个程度,我在乎的数据我已经都拿到了。
短期内对我解决需求来说已经非常足够了。
能够可视化Caddy的流量对业务发展非常重要。如果你不知道应用是如何被使用的,就没有一个指标能评价业务的发展。整体来看这套设施建设不算困难,一旦建设好了以后,就可以每天盯着仪表板享受了!
日志采集与分析的实现路径清晰且高效,但有几个技术细节值得进一步探讨。首先,Caddy日志的解析是否考虑了格式的动态变化?例如,当Caddy配置调整导致日志字段增减时,当前的转换逻辑能否自动适配,还是需要人工干预调整解析规则?这在长期运维中可能成为潜在风险点。
其次,ClickHouse的存储优化方面,日志数据的写入频率和分区策略如何设计?如果日志量级达到TB级别,是否采用按时间分区+符号列索引的组合策略来提升查询性能?此外,日志表的TTL设置是否与业务需求匹配,避免存储成本过快增长?
关于可视化部分,Superset的维度建模是否充分利用了ClickHouse的物化视图能力?比如预聚合某些高频查询指标(如PV/UV统计),还是完全依赖实时查询?这种设计对分析延迟和系统资源的平衡有何考量?
最后,整个数据链路的可靠性保障机制值得关注。当采集进程出现异常或ClickHouse写入失败时,是否有重试机制或数据缓冲队列(如Kafka)作为容错手段?日志数据的端到端处理延迟目前控制在什么范围内,是否满足实时监控的需求?这些工程实践的细节往往决定系统的稳定性和可维护性。